As you may have noted, I'm busy with the performance on this website lately as we just talked about optimizing animated content, and improving our lighthouse score.
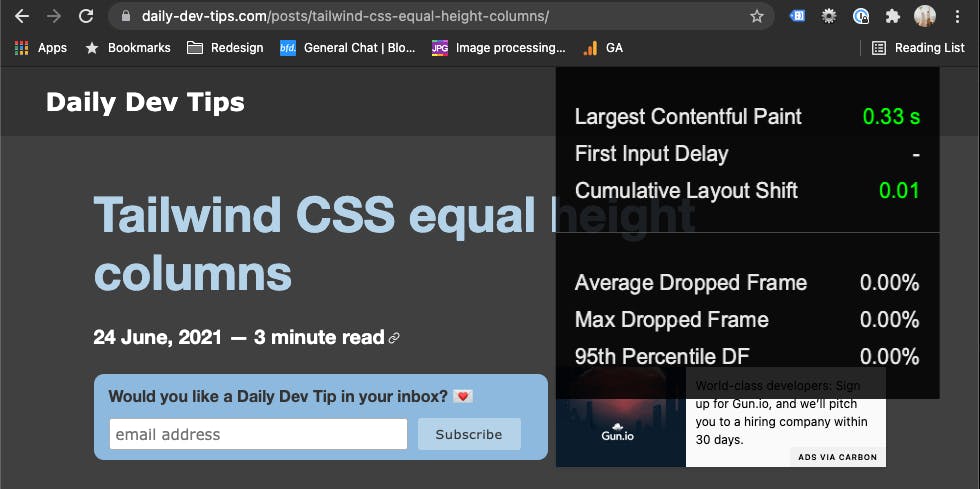
And with that, I found a super cool feature in Chrome, a so-called Performance Heads-up Display (HUD) baked in the core of Chrome!

This used to be an extension that you could add to Chrome, but it's now inside Chrome. The display shows very useful information that you know from Lighthouse.
Including:
- Largest Contentful Paint
- First Input Delay
- Cumulative Layout Shift
- Average Dropped Frame
- Max Dropped Frame
- 95th Percentile DF
Enable the performance heads-up display in Chrome
Of course, you are now wondering how to enable this, right?
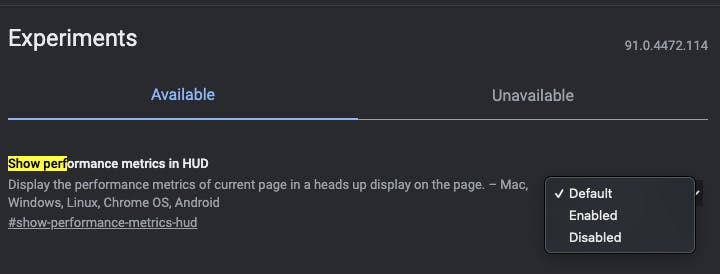
- Type
about:flagin your chrome browser - Search for
Show performance metrics in HUD - enable it and relaunch Chrome
These steps make it available in the top right corner.

This is super useful when doing many performance upgrades that you want to check right away, without waiting for Lighthouse to render.
The feature is also coming to mobile, but it doesn't seem to be in Chrome for iOS yet.
I am looking forward to also having the display there.
Thank you for reading, and let's connect!
Thank you for reading my blog. Feel free to subscribe to my email newsletter and connect on Facebook or Twitter

